
The Latest Improvements in Extended Module Reliability Testing: PVEL’s Updated PQP 

By Kevin Gibson

November 8th, 2023

Introducing the latest updates to PVEL’s PV Module Product Qualification Program (PQP)

For more than a decade, PVEL has served as the solar industry’s leading independent test lab for photovoltaic (PV) modules. As the industry has grown and changed over the years, we’ve regularly updated our Product Qualification Program (PQP) to accommodate new module technologies, designs, and sizes to generate data that matters for solar buyers. The results of this testing are presented in our annual PV Module Reliability Scorecard, a procurement resource accessed by thousands of PV buyers around the world.  

In pursuit of a strong solar future, and with our downstream partners’ project performance concerns in mind, our latest PQP has been upgraded to better assess the long-term performance potential of the latest PV module designs. Here are the highlights from our latest PQP:  

  • We’ve added a new test to address concerns around UV-induced degradation (UVID).
  • We’ve updated our Hail Stress Sequence (HSS) and Mechanical Stress Sequence (MSS) to better quantify module mechanical durability. 
  • We’ve streamlined our Light-Induced Degradation (LID), Damp Heat (DH), Light- and Elevated Temperature-Induced Degradation (LETID), and Backsheet Durability Sequence (BDS) testing, and simplified some characterizations to improve our test operations and accelerate project timelines without impacting data integrity.   

Since January 2022, we have had over 50 global module manufacturers submit their modules for PVEL PQP testing. Through our testing, these module manufacturers are providing critical data to their customers and we’re proud that our work guides the global buying community to make more informed procurement decisions.   

Test sequences in our PV Module PQP

Our PQP was designed to evolve with the needs of the PV module buyer community. Every two years, we update the PQP using feedback from leading global research institutes, independent engineers, developers, and manufacturers.  Therefore, the PQP isn’t a static suite of tests (like some industry standards that take years to update), but rather a dynamic program built in response to technology advancements, industry developments, and analysis of module performance in the field.  

Our assessment starts before PV modules even reach our labs. For each PQP, we deploy PI Berlin, our sister company and fellow member of the Kiwa Group, to perform a PQP sample production factory witness. Our team monitors the sample production process from opening raw materials packages all the way through the production line to wrapping the completed pallets of PQP samples in tamper-proof tape. During this process they collect over 100 bill of materials (BOM) details. For our latest PQP update, we’re going beyond this list of BOM details to gather even more information at the factory, including obtaining detailed data sheets for all PV module components.   

As seen in the chart below, other PQP changes include the addition of a UVID test, streamlined DH, LETID and BDS testing, and hail testing more focused on determining the threshold of glass breakage. 

Our new PV Module PQP in one chart

Explore updates to our PQP by expanding the sections below

New: UVID Test

New cell technologies such as HJT and TOPCon are marketed with improved first year and annual degradation rates, but both technologies have been shown1, 2 to be sensitive to ultraviolet light-induced degradation (UVID) , in particular when combined with UV-transmitting encapsulants. Research has shown that one the main mechanisms of this degradation is damages to the cell passivation layers and interfaces with the silicon bulk caused by UV light. 

At the same time, PVEL’s recent testing has shown that commercially mass-deployed PERC modules can also exhibit UVID-related power loss. We’ve developed a new UVID test sequence to assess these concerns as these technologies continue their rapid adoption.  

The 120 kWh/m2 of front-side UV exposure, with test samples in short-circuit condition (Isc) and a temperature of 60°C, will allow modules buyers to understand if modules are susceptible to UVID in a relatively quick and economical test.  This test duration is equivalent to approximately one or two years of field exposure, depending on the location, and is intended to provide a screening method for assessing the suitability of the manufacturer’s warranty conditions. 


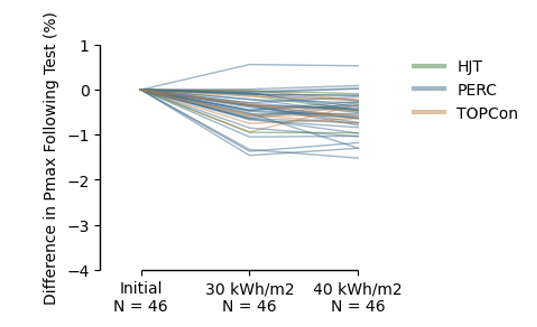
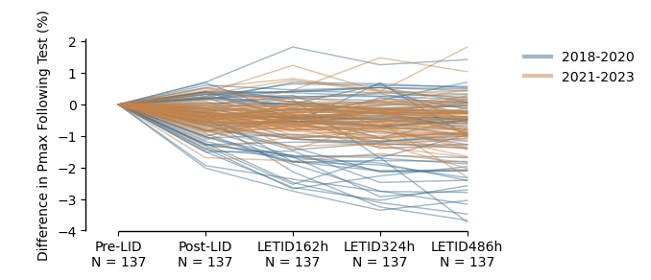
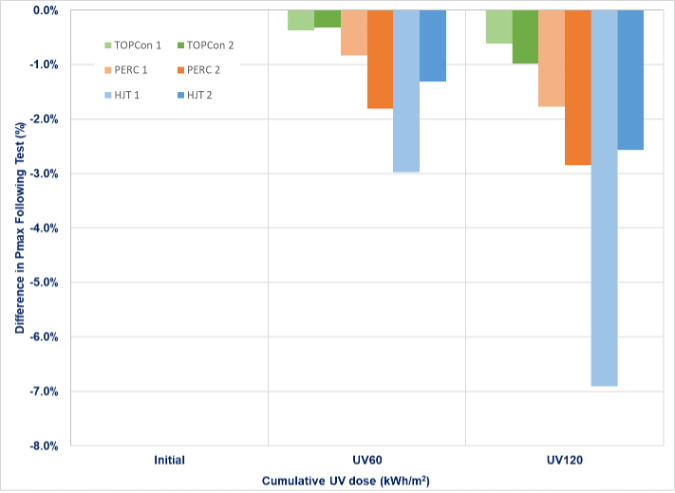
UVID results from PVEL’s recent testing of randomly selected modules shows a range of susceptibilities and power loss. Note: results are not a statistically significant sample of each cell technology and other results may vary. 


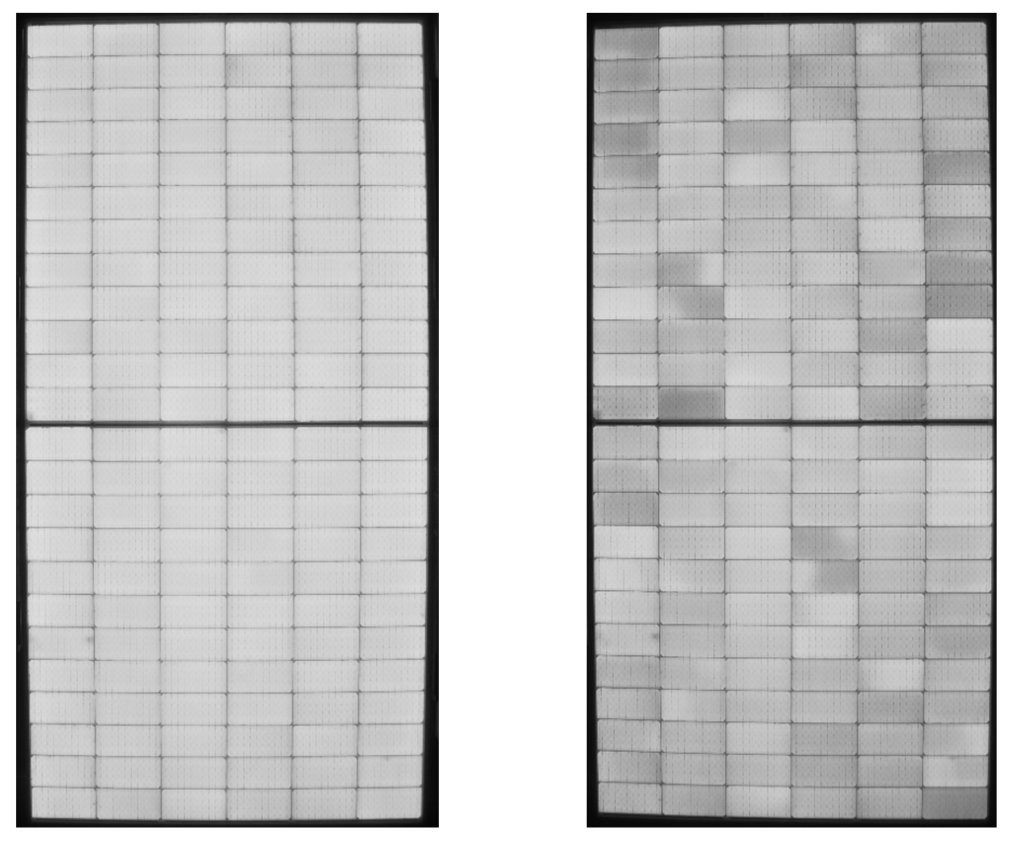
Post-UVID120 change in EL image for a UV-sensitive PERC module. 


While several researchers have observed a higher degradation when performing rear-side UV exposure, up to a factor of four1 for some technologies, it is important to note that even optimized bifacial systems see an average of less than 10% bifacial gain. Of this rear side irradiance boost, only a limited amount falls within the UV spectral region, so one would expect the annual UV dose on the rear side to be lower by a factor greater than 10. Thus, PVEL’s UVID test has been focused on the most impactful metric which is front side power degradation. 


1 Archana Sinha, et al. UV-induced degradation of high-efficiency silicon PV modules with different cell architectures https://doi.org/10.1002/pip.3606  

 2 Witteck R, Schulte-Huxel H, Veith-Wolf B, et al. Reducing UV induced degradation losses of solar modules with c-Si solar cells featuring dielectric passivation layers. In 2017 IEEE 44th Photovoltaic Specialist Conference (PVSC), 2017, pp. 1366-1370. doi:10.1109/PVSC.2017.8366019 Reducing UV induced degradation losses of solar modules with c-Si solar cells featuring dielectric passivation layers | IEEE Conference Publication | IEEE Xplore 

Refocusing Hail Testing

Recent hail events in multiple global locations have shown that hail is getting larger and more frequent in size, exacerbating the strong need to “test for failure.” During this time, we’ve also observed a high glass breakage rate (> 85%) for glass//glass modules when testing with 50 mm hail. This glass breakage rate drops to < 35% for glass//backsheet modules. 

  Glass breakage rates (%) 
Hail size (mm)  All  G//G  G//B 
30  0%  0%  #N/A 
35  21%  24%  0% 
40  63%  63%  #N/A 
45  50%  100%  0% 
50  70%  89%  34% 

The glass breakage rates for different hail sizes after the introduction of HSS in 2021. Includes all modules, as well as separating glass//glass modules (“G//G”) and glass//backsheet modules (“G//B”).  

In our new HSS test, each BOM will be subjected to two different hail sizes. For 2.0 mm by 2.0 mm glass//glass modules we will start by testing two modules to 40 mm hail. If glass breakage occurs we will retest two additional samples using 35 mm hail. If there is no glass breakage during 40 mm hail testing, the two additional samples will be tested with 45 mm hail. For glass//backsheet modules, we will start with 50 mm hail, then increase to 55 mm on two additional samples if no glass breakage during the 50 mm hail test, or decrease to 45 mm if there was breakage. 

With this increased focus on glass breakage encouraged by developers and investors deploying projects in hail prone areas, we have made the post-hail DML+TC+HF testing optional. This subsequent testing is designed to take cell crack related power loss to its maximum point, but with recent module technology including MBB cells, we’ve seen that this power loss is minimal (P50/P90 power losses respectively 1.05% and 2.21%). We have also previously reported that for glass//glass modules, glass breakage occurs before extensive damages to the cell.  

Statistical analysis of PQP hail test data showed the amount of power degradation post-HSS to be very limited, mainly due to the use of glass//glass modules and MBB cells. Often the observed power  degradation post HF10 is not related to expansion of the cell cracks (as shown by Isc loss during TC50 and HF10 exposure).   

More Aggressive MSS Mounting

PVEL’s recent discussions with various site owners have revealed several cases involving high glass breakage failure rates in the field. And PVEL’s testing has shown modules that are PV Module Reliability Scorecard Top Performers for MSS when mounted using traditional two-rail mount, but can exhibit weaknesses when using a tracker-mounted solution. This has inspired the change from the two-rail mounting we’ve used for the load testing portion of MSS historically, to using tracker-mounting based on Nextracker’s torque tubes and 400 mm module rails, or corner mounting. These mounting methods represent what is typically used in utility, C&I and residential projects, thus making MSS testing more field relevant.  

Modules with 400 mm mounting holes will be load tested using the tracker-mounted version of the test, otherwise they will be corner-mounted. Once mounted, PVEL will apply a reduced load of ±1800 Pa during static mechanical load (SML), down from the ±2400 Pa specified in IEC 61215, but sufficient for most sites using this more aggressive mounting. 


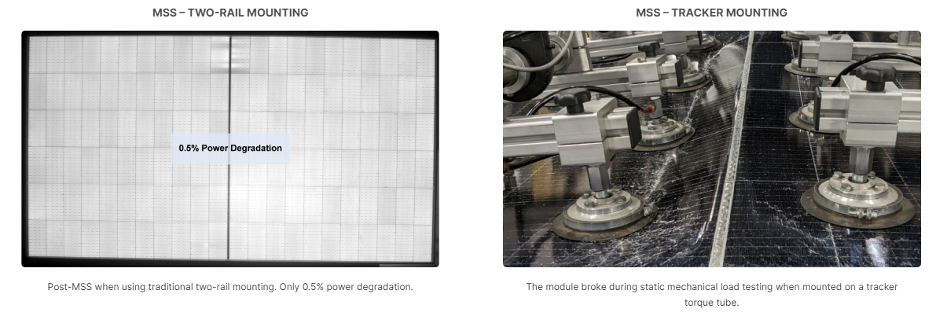
This example shows the same large-format glass//glass module (2384 x 1303 mm) performing exceptionally well during the standard MSS test (on the left), but experiencing glass breakage when tested at < 1600 Pa when mounted to a single axis tracker torque tube (on the right). 


Faster LID Quantification

Testing light induced degradation (LID) for repeated rounds of light exposure and flash testing allowed PVEL to show stabilization, but recent cell technology improvements have allowed us to simplify our LID testing to one light soaking exposure of 40 kWh/m2. 

With the change to Ga-doped and n-type in recent years, we have observed significant improvements in LID results over the 2022-2023 PQP projects, with the vast majority of modules exhibiting stability within 40 kWh/m2 exposure and degradation rates below 0.5%. 

As most of the PQP stress testing occurs after completion of LID testing, this faster LID test will result in positive ripple effects across most PQP test timelines. 

PVEL’s LID test results over the past two years show that the majority of modules are stable following one round of light soaking, with inconsequential changes between 30 and 40 kWh/m2 

Backsheet Durability Sequence (BDS) Updates

BDS has been updated in three ways: 

  • We’re shifting to mini-modules for BDS testing
    • Studies1,2 have shown that using mini-modules is sufficient for backsheet degradation testing. IEC 63209-2 was published in 2022 defining mini-module designs and sequential stress tests. Following this guidance for BDS test samples will allow PVEL to offer BDS testing at a more economical price while not compromising data quality.  
  • Shortened the initial DH exposure to 200 hours
    • The damp heat duration has reduced from 1000 hours to 200 hours as this has been found to cause sufficient moisture saturation of backsheets. This allows for the full BDS test to be completed one month quicker. 
  • Removal of wet leakage characterization
    • Field cracked modules (for example AAA and PVDF based backsheets) have been shown to pass the IEC 61215 wet leakage test, while showing obvious cracking. Removing this characterization allows PVEL to focus on visual inspection of backsheet micro-cracks and discoloration, thus more efficiently detecting product failures.  


1 M. D. Kempe, T. Lockman and J. Morse, “Development of Testing Methods to Predict Cracking in Photovoltaic Backsheets,” 2019 IEEE 46th Photovoltaic Specialists Conference (PVSC), Chicago, IL, USA, 2019, pp. 2411-2416, doi: 10.1109/PVSC40753.2019.8980818.  

2 Uličná, S., Owen-Bellini, M., Moffitt, S.L. et al. A study of degradation mechanisms in PVDF-based photovoltaic backsheets. Sci Rep 12, 14399 (2022). https://doi.org/10.1038/s41598-022-18477-1 

Other Improvements

Damp Heat 

With the industry’s move to gallium-doped PERC in late 2021, and is now transitioning quickly to N-type technologies, we have removed BO stabilization following DH2000. We are no longer observing meta-instabilities in our 2022-2023 PQP testing.


LETID 

Our statistical analysis of over six years of PQP LETID test data shows strong improvement trends, coupled with the industry shift to gallium-doped PERC and N-type cell technologies. Besides, we observed very limited changes between the last two LETID exposure steps, demonstrating that by a large majority, modules have reached full stabilization after 364 hours of LETID exposure. This has allowed us to harmonize our LETID test with IEC TS 63342:2022, by changing the initial LID to current-induced degradation (CID) testing at a controlled temperature, doubling the current injection level to 2x(Isc-Imp), and reducing the test duration to two rounds of 162 hours.  


LID and LETID results from PVEL’s database show that BOMs from 2021 to present have less degradation and more stability following two rounds of LETID testing. 

Characterizations 

As most module failure modes do not show relevant dichotomies in the degradation extent between STC (1000 W/m2) and low-light (200 W/m2) conditions, we’ve removed low irradiance and low current EL testing from our interim characterizations. This allows streamlining test operations without lowering the breadth of meaningful information available in PQP reports.  

Learn more about our Product Qualification Programs

Our PQP connects the global downstream community with PV module manufacturers through data for technical due diligence.

Sign up as a ManufacturerSign up as a downstream Partner